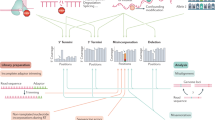
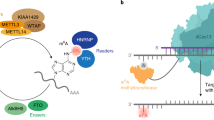
Chemical modifications to messenger RNA are increasingly recognized as a critical regulatory layer in the flow of genetic information, but quantitative tools to monitor RNA modifications in a whole-transcriptome and site-specific manner are lacking. Here we describe a versatile platform for directed evolution that rapidly selects for reverse transcriptases that install mutations at sites of a given type of RNA modification during reverse transcription, allowing for site-specific identification of the modification. To develop and validate the platform, we evolved the HIV-1 reverse transcriptase against N 1 -methyladenosine (m 1 A). Iterative rounds of selection yielded reverse transcriptases with both robust read-through and high mutation rates at m 1 A sites. The optimal evolved reverse transcriptase enabled detection of well-characterized m 1 A sites and revealed hundreds of m 1 A sites in human mRNA. This work develops and validates the reverse transcriptase evolution platform, and provides new tools, analysis methods and datasets to study m 1 A biology.
This is a preview of subscription content, access via your institution
Access Nature and 54 other Nature Portfolio journals
Get Nature+, our best-value online-access subscription
cancel any time
Subscribe to this journal
Receive 12 print issues and online access
265,23 € per year
only 22,10 € per issue
Buy this article
Prices may be subject to local taxes which are calculated during checkout
Raw and processed m 1 A-IP-seq and m 1 A-quant-seq data are available at NCBI Gene Expression Omnibus, accession number GSE123365. The DNA sequence of RT-1306 is shown in Supplementary Table 1, and the plasmid for bacterial expression of RT-1306 is available on Addgene with the ID 131521. The data that support the findings of this study are available from the corresponding author upon request.
Processing scripts for synthetic m 1 A oligonucleotide library, m 1 A-IP-seq and m 1 A-quant-seq are available in the Supplementary Data.
We thank the entire staff at the University of Chicago Comprehensive Cancer Center sequencing facility at for performing the Sanger and NGS sequencing measurements; T. Pan for sharing the ModSig libraries; L. Zhang and C. Liu for sharing the protocols for constructing biological RNA libraries; L. Hu and L. Luo for helping with protein purification. This work was supported by the University of Chicago, National Human Genome Research Institute (RM1 HG008935, C.H. and B.C.D.) and the National Institute of General Medical Sciences (R35 GM119840, B.C.D.) of the National Institutes of Health, the University of Chicago Medicine Comprehensive Cancer Center (P30 CA14599), the Chicago Fellows Program (H.Z.) and the MSTP Training Grant (T32GM007281) (C.S.). S.N. is an HHMI fellow of the Damon Runyon Cancer Research Foundation (DRG-2215-15). C.H. is a Howard Hughes Medical Institute Investigator.
B.C.D., C.H., and H.Z. conceived the idea of the project and designed the experiments. H.Z. performed the directed-evolution experiments with assistance from S.R., who performed the initial screening experiment on the Broccoli DNA. H.Z. prepared protein samples and carried out biochemical characterizations, NGS library preparations, NGS data processing and analyses. Q.D. synthesized the RNA oligonucleotides used in this study. S.N. and C.S. assisted with cell culturing for biological RNA library preparations. X.C. and Z.Z. assisted with NGS data analysis pipeline, enrichment and statistical analyses. H.Z., C.H., and B.C.D. wrote the manuscript with critical inputs from S.R., Q.D., X.C., Z.Z., S.N. and C.S.
H.Z., C.H., and B.C.D. have filed a provisional patent application for the RTs described in this manuscript. C.H. is a scientific founder and a member of the scientific advisory board of Accent Therapeutics, Inc.
Peer review information Rita Strack was the primary editor on this article and managed its editorial process and peer review in collaboration with the rest of the editorial team.
Publisher’s note Springer Nature remains neutral with regard to jurisdictional claims in published maps and institutional affiliations.
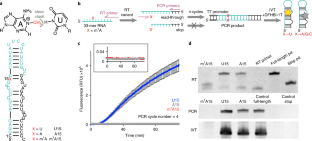
a, Screening results for single-site mutations in Broccoli DNA show various levels of decrease in fluorescence during IVT. Fluorescence traces are color coded for the mutations at different sites as shown in the secondary structure; electrophoresis of IVT products is shown on the right to show similar amount of RNA are produced. b, Test of fluorescence intensities of various mutations at U15 of Broccoli aptamer and at the A36 site that is complementary to U15 based on the secondary structure prediction. c, A zoomed-in view of the fluorophore-binding structure in the reference crystal structure of the Spinach RNA aptamer that is sequentially similar to Broccoli RNA.
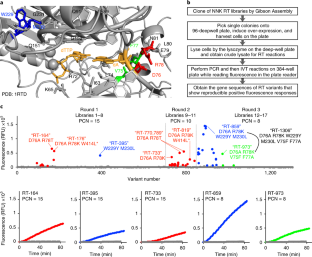
a, Results from the validation test of the RT-PCR-IVT assay with purified wild-type HIV-RT p66, with varying numbers of PCR cycles is shown on the left; data shown are mean ± s.e.m. from n = 5 independent assays. 8% SDS-PAGE of the purified p66 subunit is shown on the right. b, RT-PCR-IVT assay data (mean ± s.e.m. from n = 2 independent cell cultures for RT lysates) on the positive (U15) and negative (A15) control RNA; crude lysate activity of wild-type HIV-1 RT p66 show a reliable dynamic range for mutation detection with various PCR cycle numbers. Shown on the right are high expression levels of p66 proteins in over-expressed BL21 cell lysates lysed by boiling or lysozyme treatment analyzed by 8% SDS-PAGE, with n = 2 independent cell cultures. c, Screen plate layout of 90 RT variants and 6 control samples on each 96-deep well plate for the directed evolution. Shown on the right are robust data produced from control experiments (no. of repeats = 16) of wild-type RT lysate with positive (P) U15, negative A15 (N) and m 1 A15 (B) RNA substrates throughout the first round of directed evolution screening. d, Shown on the left are two repeating assays (n = 3 cell culture replicates) for variants (RT-164, RT-176 and RT-395) that show positive responses against m 1 A15 RNA in comparison to the basal activity by the wild-type RT. The middle panel shows one repeated test from cell culture for variants (RT-110 and RT-142) that show negative responses in the screen. Protein expression levels in the crude cell lysates of four variants via 8% SDS-PAGE are shown on the right in duplicates. This shows that lack of fluorescence responses in RT-110 and RT-142 is not due to lack of protein expression.
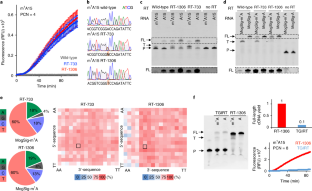
a, Purified wild-type HIV-1 RT p66 and evolved variants RT-733 and RT-1306 are shown with 8% SDS-PAGE. b, RT-PCR-IVT assay data on the positive (U15) and negative (A15) control RNAs with purified wild-type HIV-1 RT p66, and evolved variants RT-733 and RT-1306; data shown represent mean fluorescence intensities ± s.e.m from n = 5 independent assays. c, Sanger sequencing data showing no detectable mutation signatures on the negative control A15 RNA by the wild-type and evolved RT variants. The A15 position is noted between the dashed lines. d, The overall mutation signatures of wild-type HIV-1 RT over the ModSig-m 1 A library and the sequence-context-dependent mutation rates at the m 1 A site.
Heatmaps show mutation patterns (A to T, G, or C) of the wild-type and evolved RT variants in 256 sequence contexts in the ModSig-m 1 A library, in comparison to those in the control ModSig-A library. Yellow boxes are sequence contexts not covered by the sequencing data.
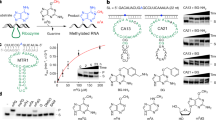
a, Shown are LC-MS/MS data of m 1 A level before and after AlkB treatment for synthetic m 1 A15 RNA (left; mean ± s.d. from n = 2 technical replicates) and polyA-enriched RNA from HEK293T cells (right; mean ± s.d. from n = 12 replicates — that is, 3 cell culture replicates and 4 LC–MS/MS injection replicates). b, Schematics for the RT-PCR-IVT assay for detecting AlkB activity using m 1 A18 RNA. Fluorescence data of positive (m 1 A18 treated by AlkB) and negative control (no AlkB added or AlkB added together with 5mM EDTA) experiments are shown on the right. Error bars represent s.e.m. from n = 2 independent assays for –AlkB and from n = 6 independent assays for +AlkB and +AlkB+EDTA. c, Optimization of the AlkB reaction condition by the RT-PCR-IVT assay for a 2-h reaction at 37 °C. Fluorescence intensities at 60 min are plotted versus various reaction components with the reaction conditions as 50 mM MES (pH 5.0), 50 μM (NH4)2Fe(SO4)2, 300 μM 2-ketoglutarate, 2 mM l -ascorbic acid, 2 mM MgCl2 and RNase inhibitor unless specified on the plot. Error bars represent s.d. from n = 2 or 3 independent assays. d, Optimization of iron concentration and reaction temperatures by the RT-PCR-IVT assay under the condition 50 mM MES (pH 5.0), 300 μM 2-ketoglutarate, 2 mM l -ascorbic acid and RNase inhibitor and noted concentrations of (NH4)2Fe(SO4)2 on the plot. Shown are mean ± s.d. from n = 2 independent assays. e, Optimization of iron concentration and reaction temperatures by LC–MS/MS assay with total RNA sample from HEK293T cells with small RNA removal. Shown are mean ± s.d. from n = 6 replicates — that is, 2 independent AlkB assays and 3 LC–MS/MS injection replicates.
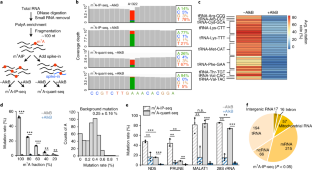
a, Schematic of library-construction procedures with evolved RT-130, and the final sequence composition of the library. b, Representative bioanalyzer analyses of NGS libraries built with RT-1306 for one of the three biological replicates. The library size is ~240 bp for all libraries with and without AlkB treatment. Considering the adaptor dimer is 132 bp, the average size of the fragmented insert is ~100 nt. c, Reproducibility examination based on correlation plots of transcriptome-wide coverage between replicates in both m 1 A-IP-seq and m 1 A-quant-seq. Each dot represents the coverages of one RefSeq-annotated RNA transcript (n = 38882) counted with ‘bedtools multicov’. At the sequencing data coverage depth of the current experiments (~100 million reads per library), transcriptome-wide coverages show decent reproducibility between replicates evaluated with Pearson’s correlation coefficient (r).
a, Dot blot of m 1 A antibody (MBL 345–3) against short 5-mer m 1 A and control m 6 A and synthetic A oligonucleotides. b, LC–MS/MS assay for quantifying m 1 A level from biological RNA sample before and after immunoprecipitation with the anti-m 1 A antibody. Quantified percentages of m 1 A and m 6 A in reference to A are shown by mean ± s.d. of n = 3 LC–MS/MS injection replicates. c, Overlay of coverage tracks of 28S rRNA between m 1 A-IP-seq (‘IP’) and m 1 A-quant-seq libraries (‘quant’). ~7-fold coverage enrichment is observed at the m 1 A1322 site together with mutation signatures. d, Overlays of coverage tracks for m 1 A sites in mRNA and lncRNA. Coverage enrichment of IP libraries is observed for ND5 and MALAT1 sites, however, not for the PRUNE site. e, Lorenz curve analysis of IP libraries as compared to quant libraries without AlkB treatment. Replicate 1 in the m 1 A-quant-seq is set as the reference for RNA expression level in HEK293T cells; the diagonal line suggests uniform coverage relative to the reference, and more deviated curves suggest more biased coverage distribution. IP libraries show significant biases relative to the quant libraries.
Shown processing scripts are reported in the Supplementary Data.
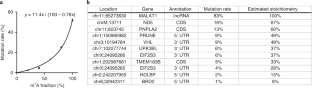
a, Comparison of transcriptome coverages (mean ± s.d.), with coverage depth per transcript cut-offs at 100 reads and 10 reads. Error bars represent the s.d. from n = 3 library replicates for RT1306, and from n = 2 library replicates for TGIRT1 and TGIRT2. b, Venn diagram of transcripts that are covered by at least 100 reads. c, Correlation plot of sequencing depth per transcript between one replicate in m 1 A-quant-seq and one replicate in TGIRT1 11 or TGIRT2 19 sequencing data without antibody enrichment, evaluated by Pearson’s r. Plotted are total n = 38882 annotated RNA transcripts in the RefSeq database. d, Comparison of mutation signatures captured by RT1306 and TGIRT1 without and with m 1 A antibody enrichment. e, Correlation plot and Pearson’s r values of mutation rates of overlapping mutation sites between RT1306 and TGIRT1, without or with m 1 A antibody enrichment. f, Comparison of mutation signatures that are AlkB sensitive (averaged demethylation ratio (DMR) > 10%) between RT1306 and TGIRT1 with m 1 A antibody enrichment, evaluated by Pearson’s r. Shown are Venn diagrams for overlapping of AlkB-sensitive mutation sites between the two datasets, correlation plot of DMR of 340 overlapping mutation sites and a Venn diagram of antibody-enriched peaks called by MeRIPtools with fold of enrichment (FC) > 2 (Methods) for RT1306 and TGIRT1.